Our scale-up flag looks at a single growth window: it ends at the company’s most recent filed accounts and starts at the most recent filed year at least three years earlier. Within that window the company needs:
- 10 or more employees at the start of the window
- at least 4 filed years of employment data with 10 or more employees
- no rise of more than tenfold between consecutive filed figures
- annualised employment growth of 20% or more per year from start to end
The data behind the flag
- Filed accounts only. Employee figures come from companies’ filed annual accounts. Each figure is attached to the year the accounts were made up to, giving at most one employment figure per filed year. Our estimated and projected employment series are never used for the scale-up flag.
- Employment, not turnover, by decision. The OECD definition allows growth to be measured by employees or by turnover. We apply the employment measure only: employee counts are disclosed far more consistently in UK filings than turnover, which smaller companies often do not file. A company scaling revenue on a flat headcount will not be flagged.
- Anomaly filtering. A figure only counts if it is greater than zero and has not been flagged by our anomaly detection (for example an implausible headcount for the size of the business). Anomalous figures are skipped entirely; they never influence the flag.
- Missing figures are skipped, not zero. Roughly 4 in 10 filed accounts carry no employee figure at all, most commonly because the filing does not include a captured headcount. A year without a figure is not treated as zero employees; the window simply starts or ends at the nearest year that has one.
- Growth is growth in the filed headcount, however it arose. We cannot fully distinguish organic hiring from acquisitions, intra-group staff transfers, or changes in how a group allocates employees between its entities; the OECD guidance acknowledges the same limitation. The tenfold cap below removes the worst of it: mis-transcribed figures and switches to consolidated group accounts arrive as huge single-year steps, while 99% of genuine qualifiers never step more than about eightfold between filings. A large step under the cap is still worth checking against the company’s accounts before reading it as organic scaling.
- Each release uses the six most recent years of accounts. The flag is recalculated with every data release; we hold the six most recent years of filed accounts (currently accounts made up to 2020 onwards). A company’s flag can therefore change between releases as new accounts arrive or old years leave the held history.
The calculation, step by step
- Take the company’s reliable filed employment figures (positive, non-anomalous), ordered by year.
- The window ends at the most recent of those figures.
- The window starts at the most recent filed year at least three years earlier. If no filed year is that old, the company cannot qualify yet.
- The company is a scale-up if all four of these hold:
- the start-year figure is 10 or more employees
- at least 4 filed years inside the window (start and end inclusive) have 10 or more employees
- no figure inside the window is more than ten times the previous filed figure
- annualised growth across the window is at least 20% per year
Worked examples
These are real companies, with employee counts exactly as filed in their annual accounts and held in our July 2026 release. You can look any of them up on the platform by company number. Their figures, and in some cases their flags, will change as new accounts arrive. Steady growth qualifies. Principle Estate Services Limited (11056986):
The window runs from 2022, the most recent filed year at least three years before the 2025 accounts. It starts at 44 (10+), has 4 filed 10+ years, and grows per year. Scale-up.
Growth must be recent. Olfasense UK Ltd (02900894):
The window runs from 2022 to 2025 and annualises at per year: not a scale-up. The company more than doubled between 2021 and 2022, and a window drawn from 2021 would average per year, but 2022 is a filed year, so the window starts there. An early jump cannot carry a recent plateau.
The flag follows the window as new accounts arrive. UD Restaurants Ltd (10515301):
When the 2023 accounts were the latest, the window ran from 2020 and annualised at per year: a scale-up. With the 2024 accounts the window moved to 2021 and fell to . With the 2025 accounts it moved to 2022 and fell to . The flag dropped as soon as the growth stopped being recent.
Years without figures are bridged. TSC Kent Ltd (10853210):
Three years before the 2025 accounts is 2022, which carries no figure, so the window starts at the next older filed year, 2021. It starts at 16 (10+), has 4 filed 10+ years (2021, 2023, 2024, 2025), and grows per year. Scale-up. The missing year still counts towards elapsed time (we divide over 4 years, not 3 observations), so bridging never inflates a growth rate.
Bridging stops at the nearest filed year. Royal London Asset Management Limited (02244297):
The 2022 and 2023 accounts carry no employee figure, so the window starts at 2021 and annualises at per year: not a scale-up. A window from 2020 would average , but 2021 is a filed year and is never skipped in search of a better rate.
Implausible steps are rejected. A real series, anonymised: a national charity that employs around 5,000 people, whose early years were transcribed wrongly at source:
The window from 2021 to 2024 would annualise at per year, but the 2021 to 2022 step is a 93-fold rise: far beyond anything hiring can do, and the signature of a data error or a switch to consolidated group accounts. Any rise of more than tenfold between consecutive filed figures inside the window disqualifies the company. Steps under the cap pass: 99% of genuine scale-ups never exceed about eightfold.
Reaching 10 employees only recently is not enough. Alexa Capital Limited (10759666):
The window starts at 2021, which has 3 employees: below the 10-employee floor, so the company is not a scale-up, however fast it is growing. This is the OECD’s own threshold, which stops very small bases producing inflated growth rates. The floor applies at the actual window start; a start below 10 is never bridged past.
Reproducing the flag from an export
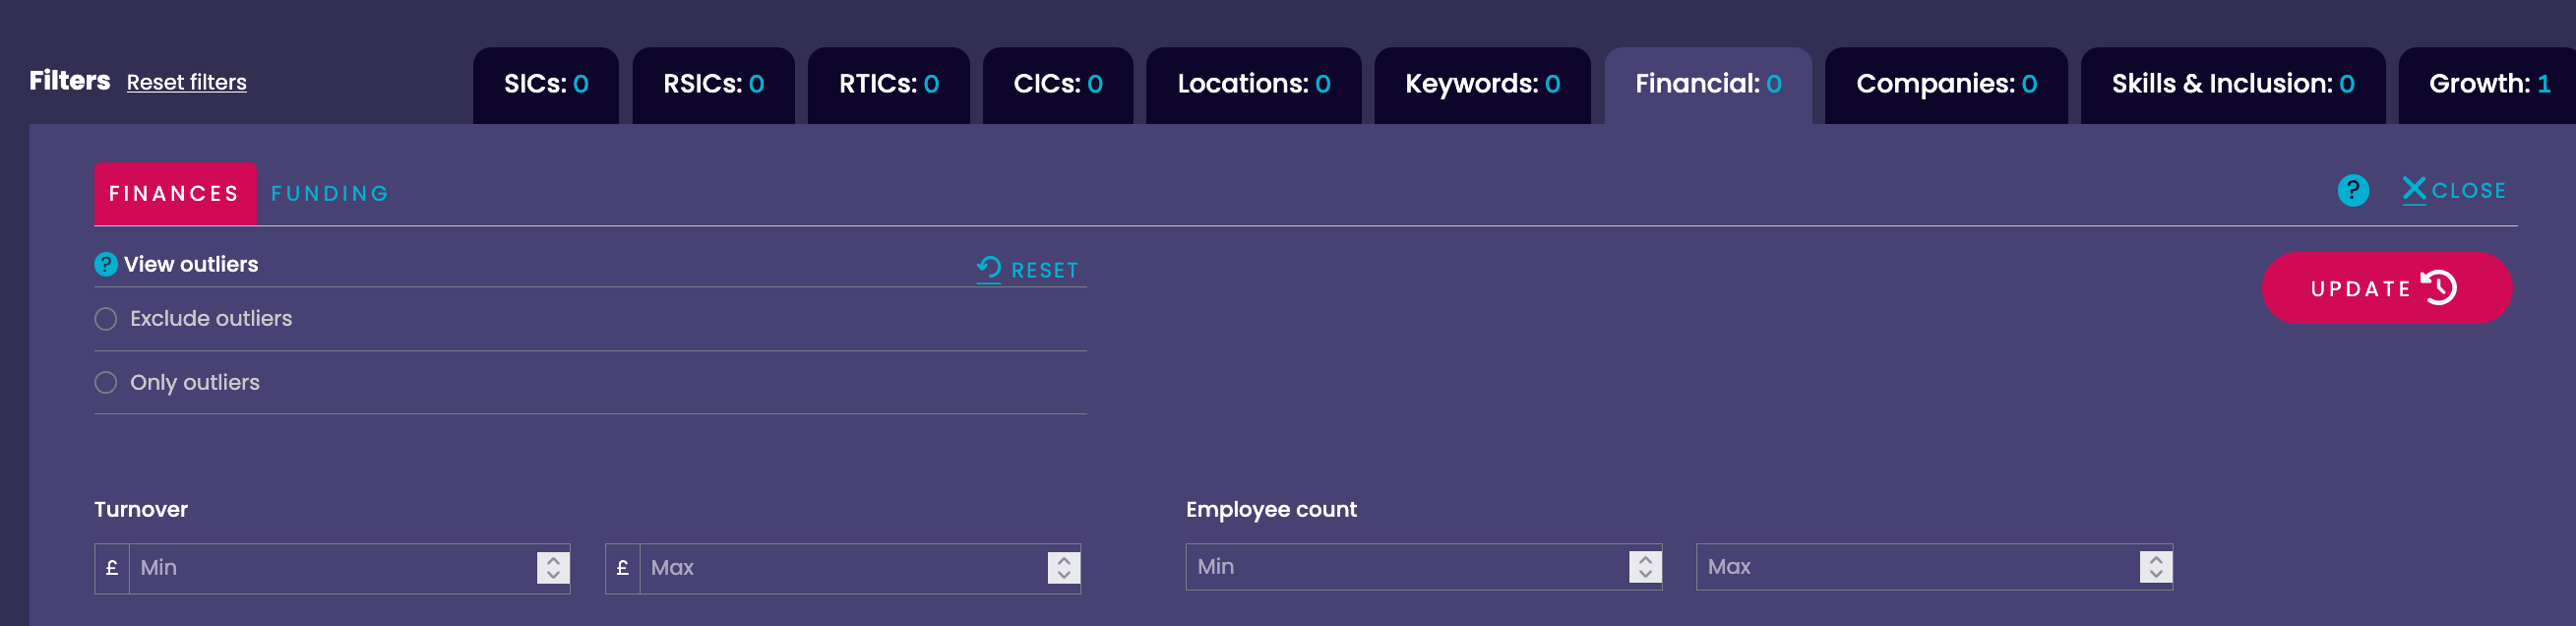
Platform exports that include the year-by-year financial history (CompanyFinancialsCreditSafe) contain everything the flag is computed from:
- Take the
Reported_Numberofemployeesfigures by year, dropping years where the figure is missing or zero, or whereDeclaredEmployeesAnomalousis true. - The window ends at the latest remaining year and starts at the most recent remaining year at least three years earlier.
- Check the four criteria: 10 or more employees at the start, four 10-or-more years inside the window, no figure more than ten times the previous filed figure inside the window, and annualised growth of at least 0.20 between the two endpoints, using the formula above.
Background
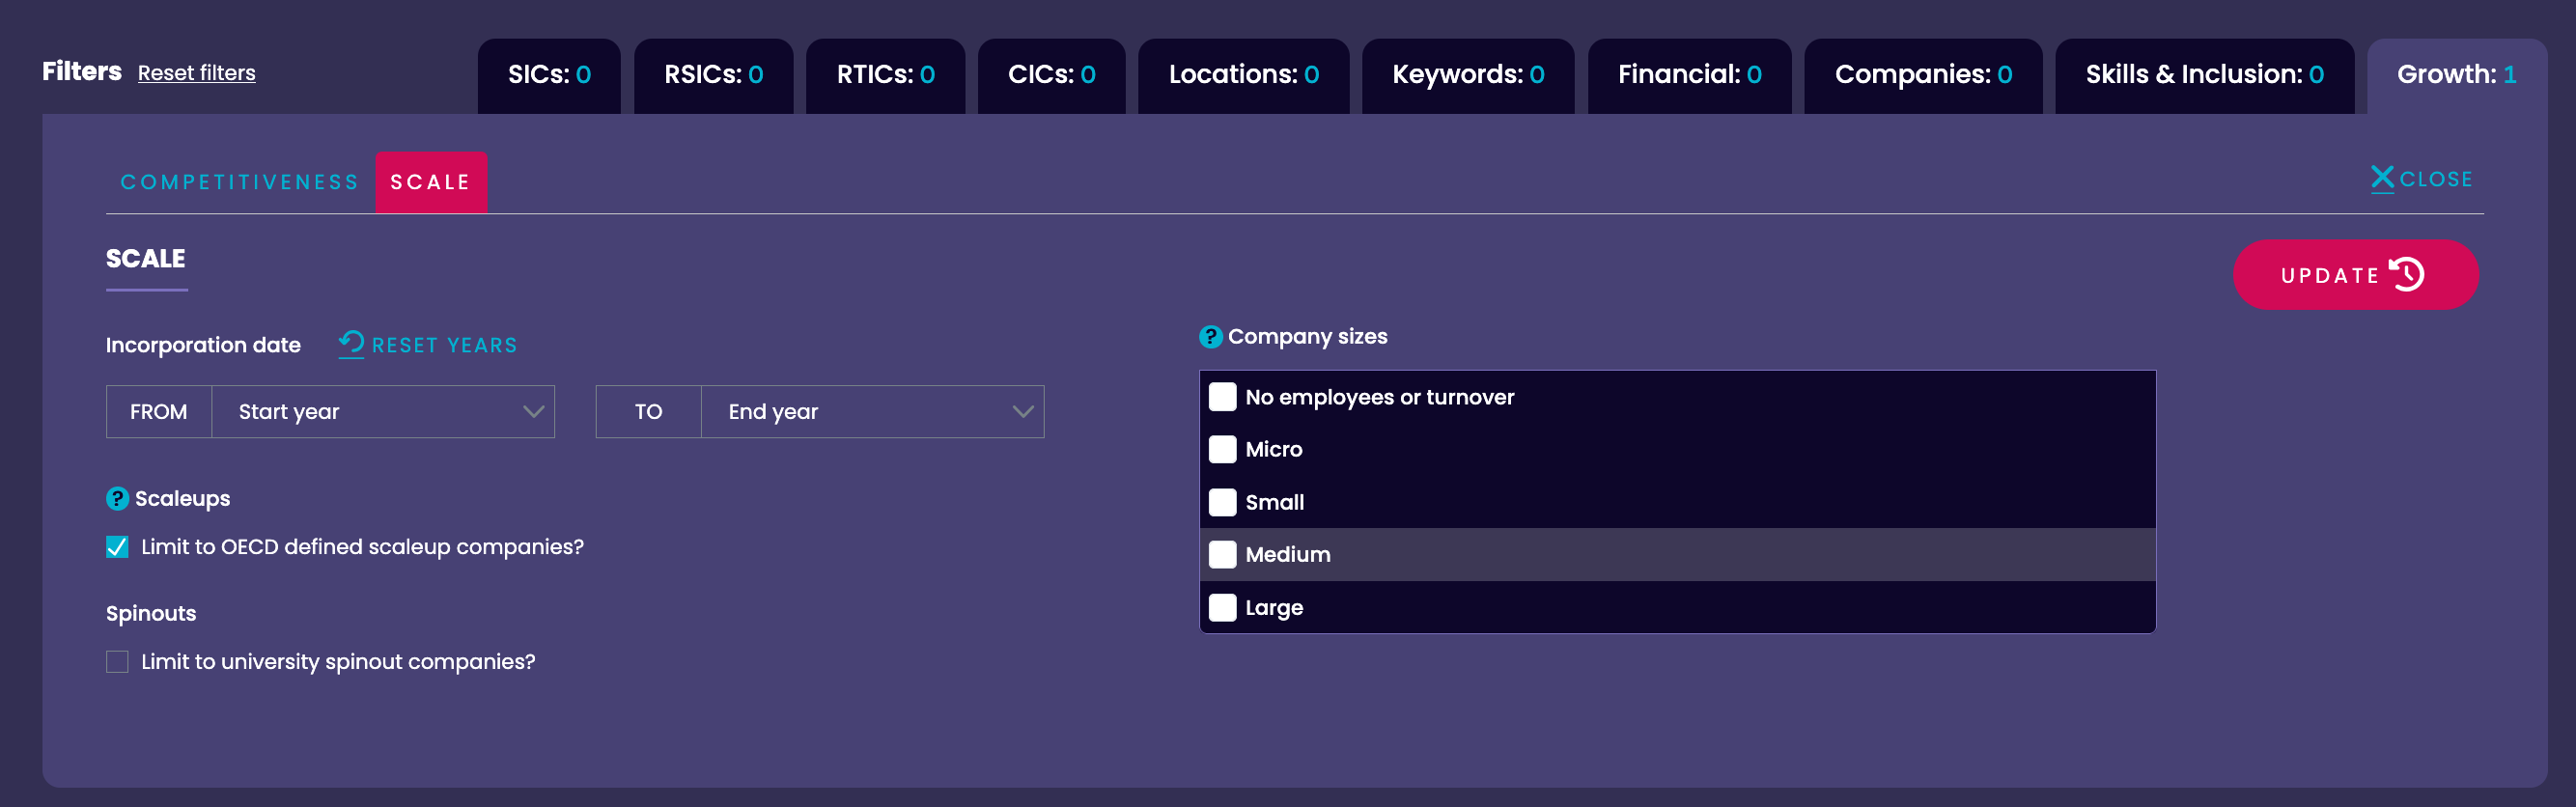
The definition of an OECD scale-up company is what we have implemented on the platform. This is the OECD definition (source): “All enterprises with average annualised growth greater than 20% per annum, over a three-year period should be considered as high-growth enterprises. Growth can be measured by the number of employees or by turnover.” Our general growth-rate metric and company size definitions are different: those do use estimated and projected figures. You can read more about those estimates and average annual growth rates here. The scale-up filter is located within the growth tab: