

Intro
Our data on company employee counts and company turnovers is provided by Creditsafe and is based on financial reportings to Companies House. We get data, per company, per year. There is often no data or missing data for all or some years. Employee count data is more common than turnover data. Since there is a lag in financial reporting, we always use estimated employees and estimated turnover for the current year’s values (this also helps to address missing data). Where we cannot estimate these values, we do not report them. We have developed our own methods for estimating company growth rates even when only limited data is available, for example, where employee counts are reported infrequently or have not been reported recently. We only estimate values where we have enough data to do so reliably.How do we Estimate Growth?
If a company has reported employee count for three years or more we fit an exponential curve to those years and use this to calculate an annual employee growth rate. We do the same for turnover. Fitting an expoential curve is needed for the statistical analysis we do and is an important part of calculating a growth rate. We do not assume that companies continue to grow at this rate.Projecting Growth
We project companies’ turnover and employees using the growth rate. We do not assume that companies continue to grow at this rate indefinitely and apply constraints to our projections. As an example of the constraints we make:- If a company switches between its own accounts and consolidated group accounts, its reported size changes without the business growing. We fit growth only on the type of accounts the company has filed most often, and leave the other years out.
- A sharp jump in the same year a company starts filing as part of a group, or stops being dormant, counts as a change of basis, not growth. If the new level holds, we leave out the years before the jump. If it does not, we leave out the jump. If the jump is in the latest year, we do not project growth forward from it.
- We limit the max projected value to a multiple of the largest value reported by the company. Smaller companies grow faster than bigger companies, so smaller companies have a higher cap than large companies.
- In some cases the number of employees a company has does not match the rest of its financials. Examples of these companies are recruitment agencies, and healthcare or education providers. For these companies we assume their employment does not change from their last reported value.
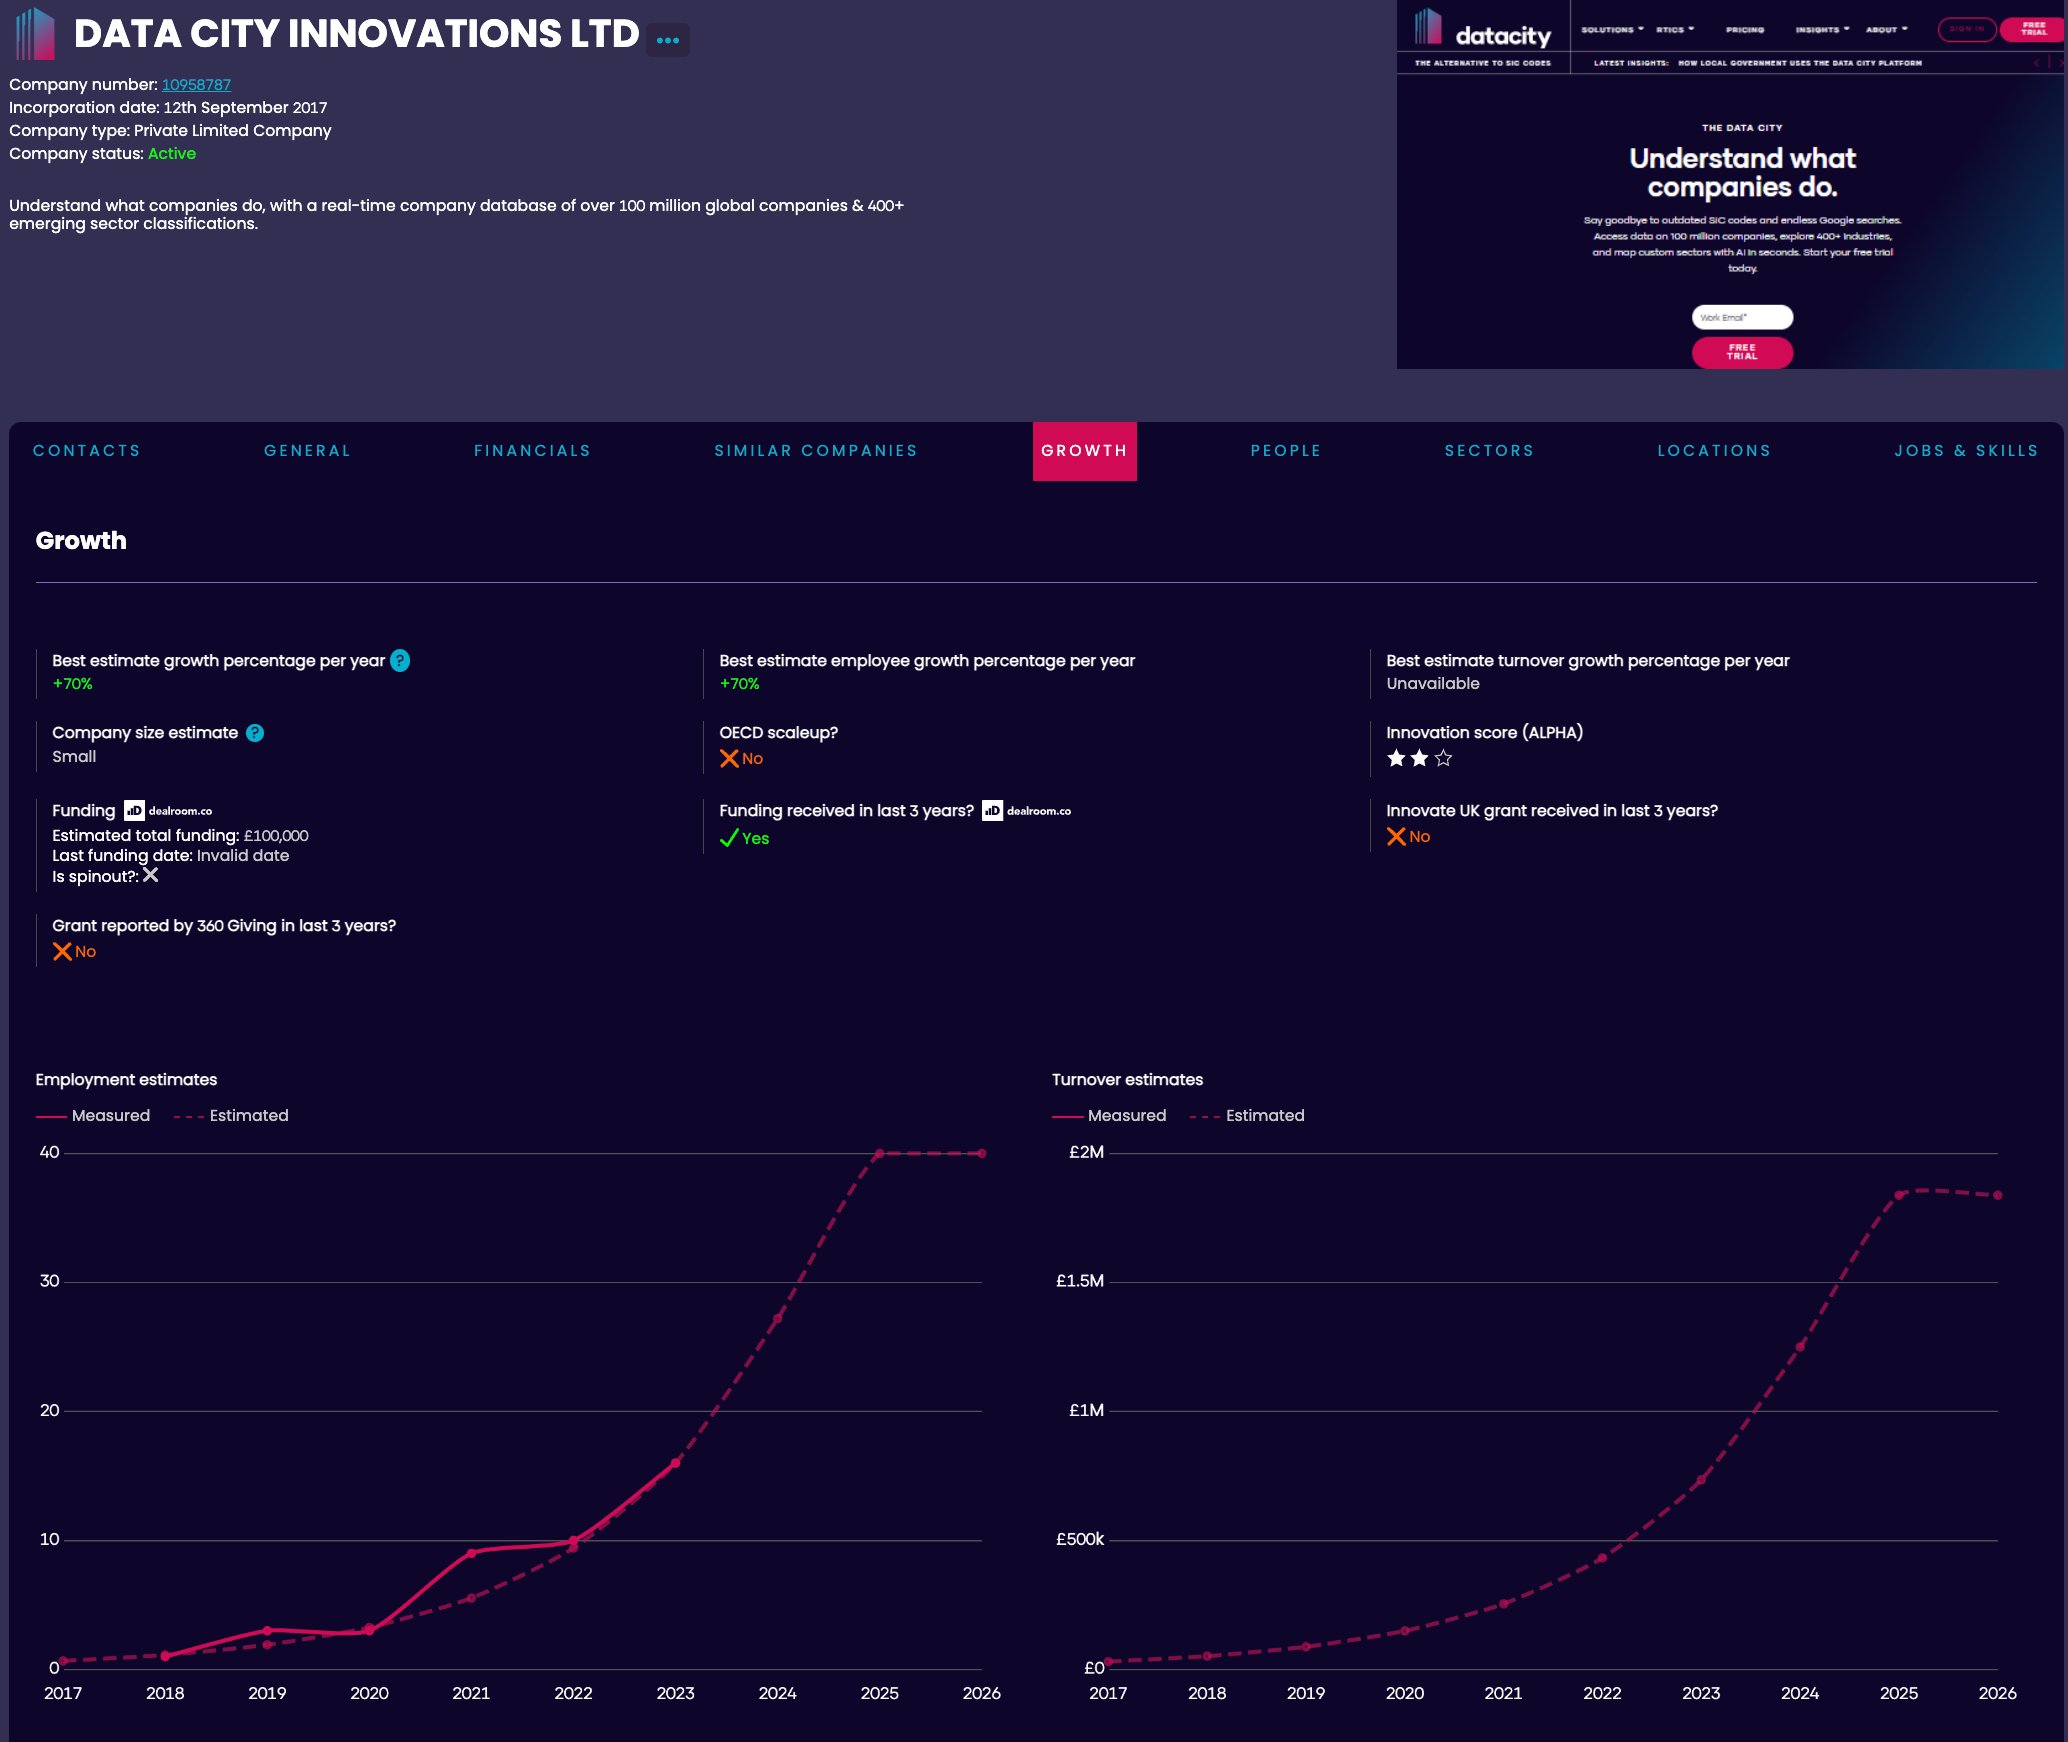
Growth in our UI
The Growth tab shows our estimates of company employees and turnover by year: best estimate employee growth percentage per year and best estimate turnover growth percentage per year. The best way for you to get a feel for our estimation algorithm is to look at the graphs in this growth tab for a few companies that you know well.Growth rate does not refer to year on year growth, but rather the average growth rate from the curve we fit. A year on year growth rate would not be able to handle missing data as well.
Caveats
- We constrain projections for sensible results.
- The method here works very well for the vast majority of companies. But some companies do very strange things with their annual accounts and these edge case can affect aggregate results especially when those companies are very large. You can read more about how we’re addressing this here.