Introducing ANALYSE
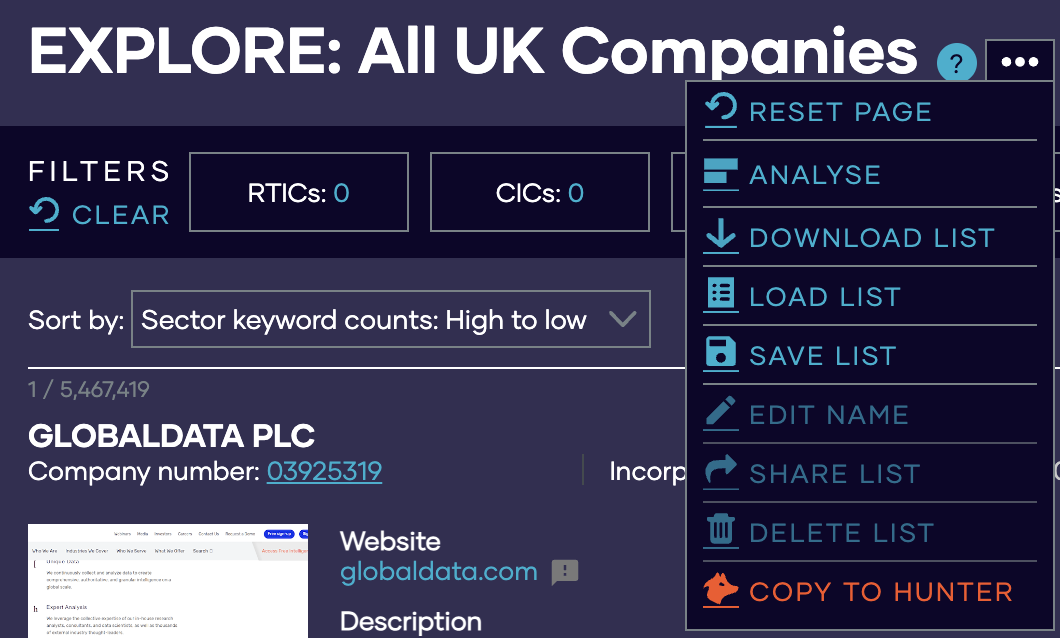
ANALYSE is the home of summary statistics on our platform. ANALYSE offers the ability to conveniently understand the total employment, amongst many other metrics, of a list of companies. The list of companies could be in the form of companies in an RTIC, a machine learning list that has been built, or simply a list of company numbers. The creation of summary statistics requires careful interpretation and careful consideration of the companies that are included in a list. This article will provide a summary of the considerations to be made for each data point, with more detail available in the relevant Knowledge Base article for that data point.Starting points for analysis

Analysing RTICs
The filter bar, shown above, contains all of the filters you need to hone and then analyse your list. From here you can choose to analyse RTICs.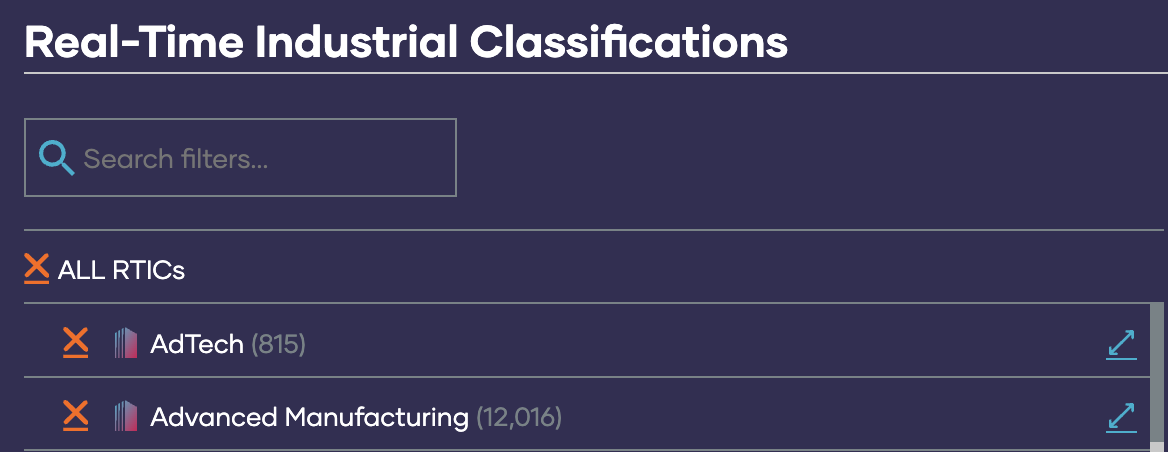
Analysing Personal Lists
If you have created your own Machine Learning (ML) list using our tool, then you can also analyse these here. Click lists in the top left, and from the dropdown, select the Smart List you have created.Analysing a List of Company Numbers
If you want to quickly get a sense of the size of a set of companies you can paste in a list of Company House numbers. In the Companies filter, select the COMPANY NUMBERS tab, and paste your list of company numbers into the box at the bottom. Click update and you will now analyse these companies.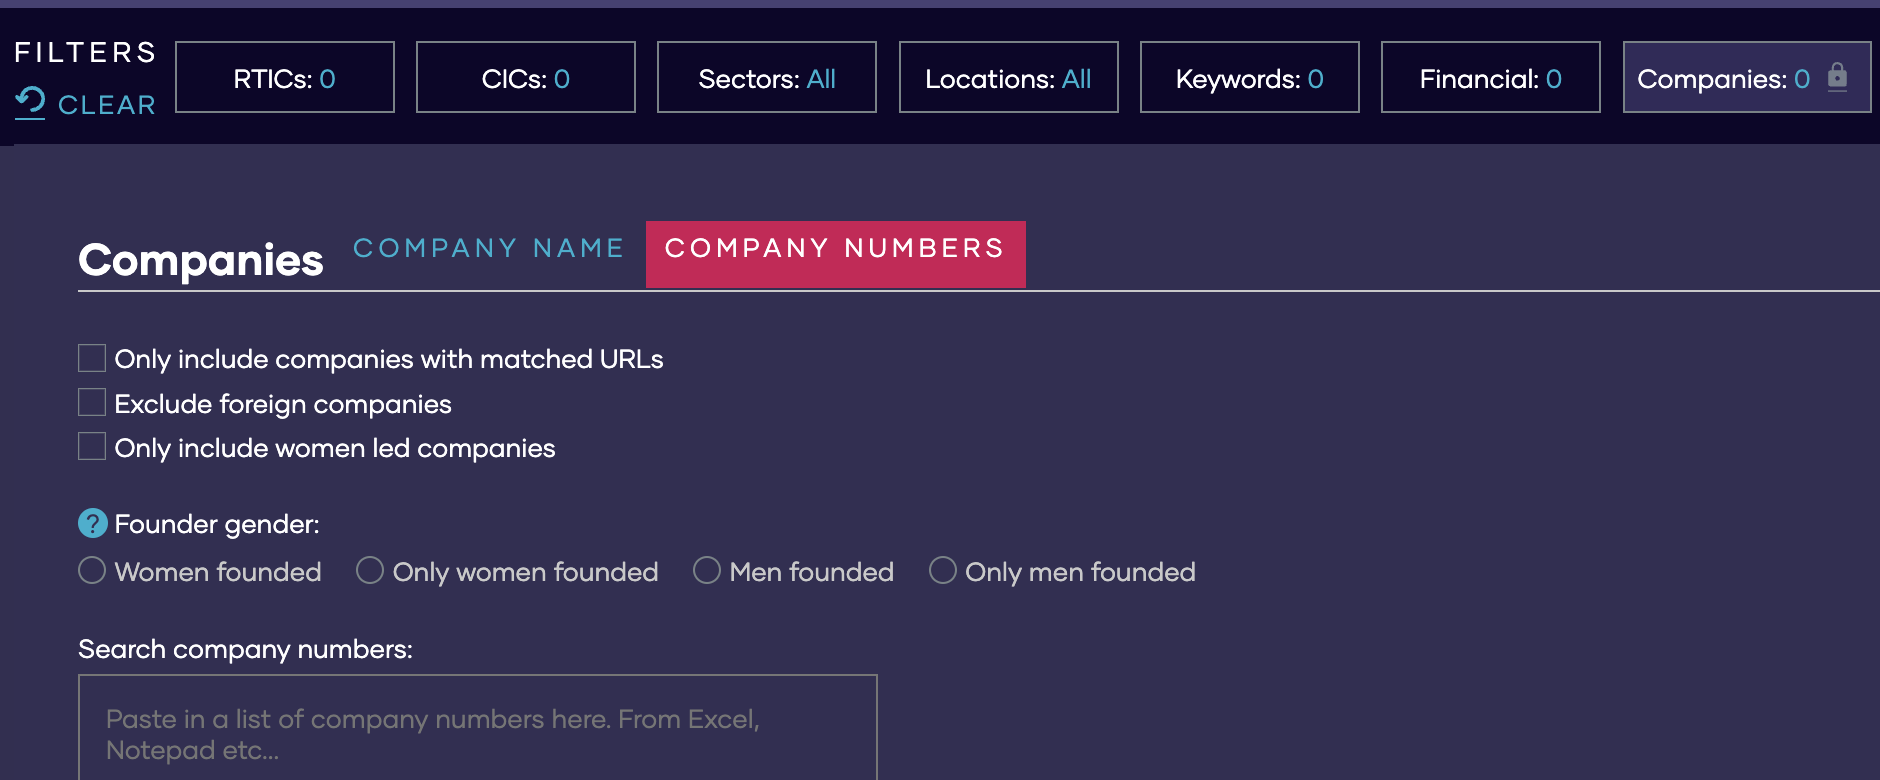

The Analysis Summary Box
When you analyse the list or RTIC that you’ve selected, the first thing you’ll see is the Analysis summary box. This is shown below.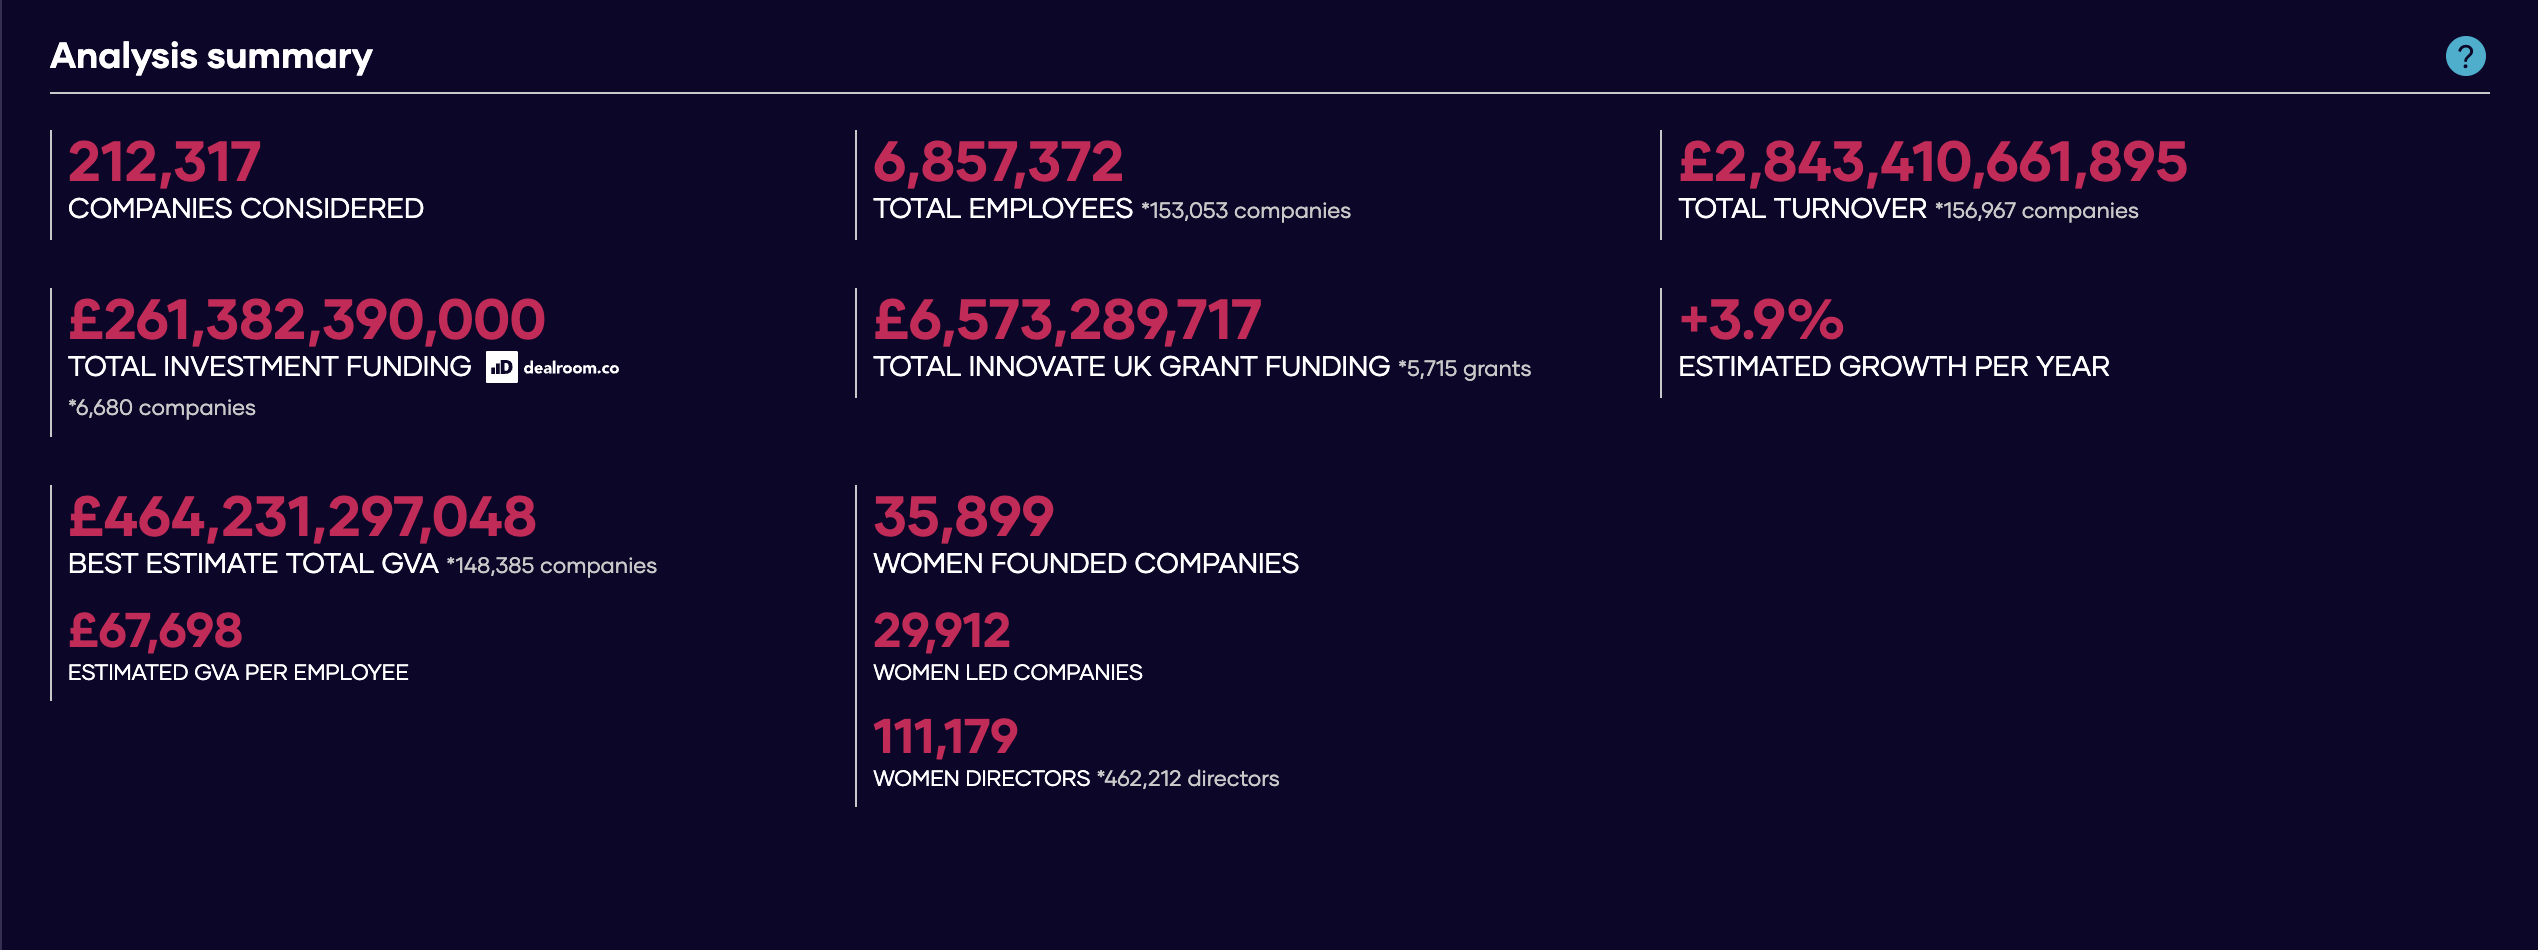
Locations
You are able to analyse the following geographies on our platform: local authorities, OECD functional urban areas, constituencies, Strategic Authorities and ITL1 and ITL2 regions. Make sure you understand the differences between these geographies. You can analyse the geographical distribution of businesses, employees and turnovers.Employees and turnovers are split equally across locations for multi-site companies.
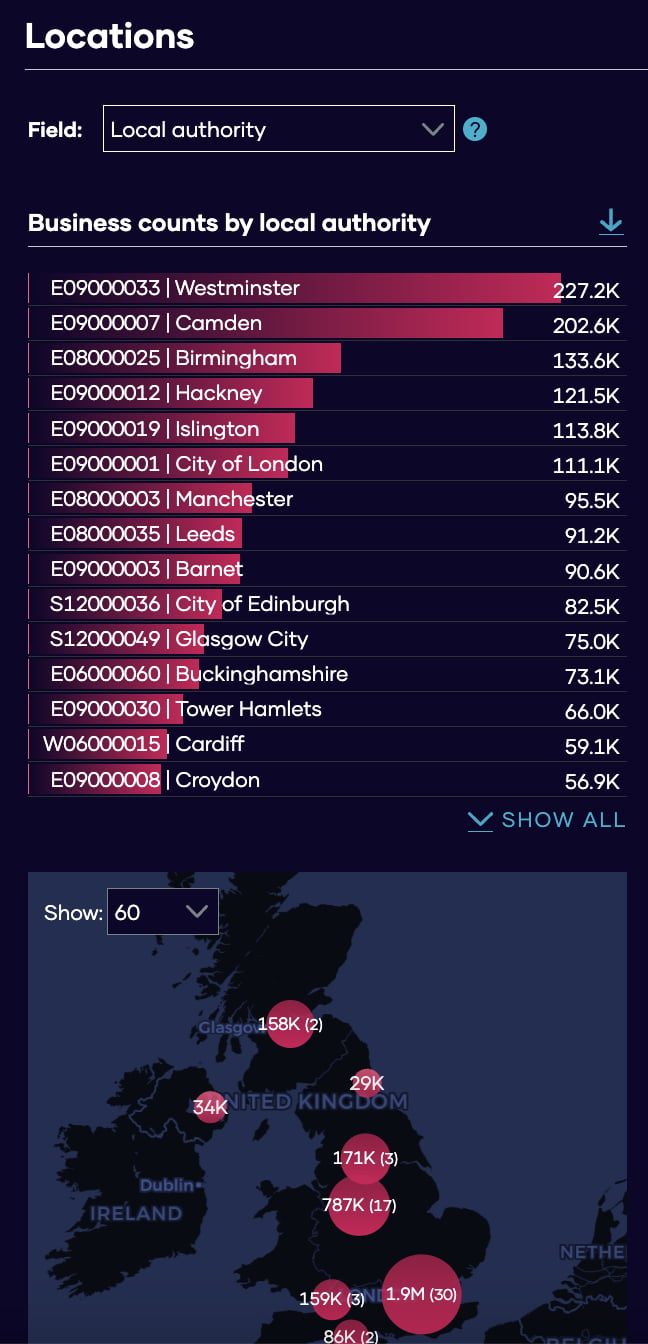
NOTE: It is possible to download the data behind many of the visualisations, by clicking the download button in the top right corner of the widget.

The number of businesses in each local authority. Where a business has operating addresses in more than one local authority, it is counted more than once. If you are filtering to specific geographies you may see results outside of those geographies where a company has additional operating addresses there. Only businesses with at least one UK employee are included. A business is counted only when its best estimate UK employees value is greater than zero (that is, when The Data City has an estimated UK headline employee count for that company). Businesses with zero or unknown UK employees are excluded from these counts. This is different from Employees by local authority and Turnovers by local authority, which use per-location employee and turnover values split across a business’s operating addresses. A company can therefore appear in the employee or turnover charts (with a zero attributed share at a given location) but not in the business count for that area if its overall best estimate UK employees is zero or unknown. Employees by local authority
The number of employees in each local authority. Where a business has operating addresses in more than one local authority, it is counted more than once. If you are filtering to specific geographies you may see results outside of those geographies when a company has additional operating addresses there. Turnovers by local authority
The total turnover of businesses in each local authority. Where a business has operating addresses in more than one local authority, it is counted more than once. If you are filtering to specific geographies you may see results outside of those geographies when a company has additional operating addresses there. You can find out about the types of geography we have on our platform and you can find out more about multiple company locations here.
Website Analysis
As you scroll down the page, the next tab is Website keywords. From the field dropdown you are able to choose either sector keywords or innovation keywords.What are sector and innovation keywords?
Sector keywords are from a dictionary of keywords that we created alongside partners. Sector keywords identified the keywords for 18 broad sectors and themes. Innovation keywords are keywords associated with innovative processes. The keywords range from “new markets”, “continuous professional development” and “lean”. The Data City have scraped up to 90 pages of website text for companies. We then count how many times the sector or innovation keywords are mentioned; this is the keyword count.Keyword enrichment
Keyword enrichment is a measure of how overrepresented a key word is compared to the average website. In this case “small molecule” is found 1209% (or 13x) more than the typical website.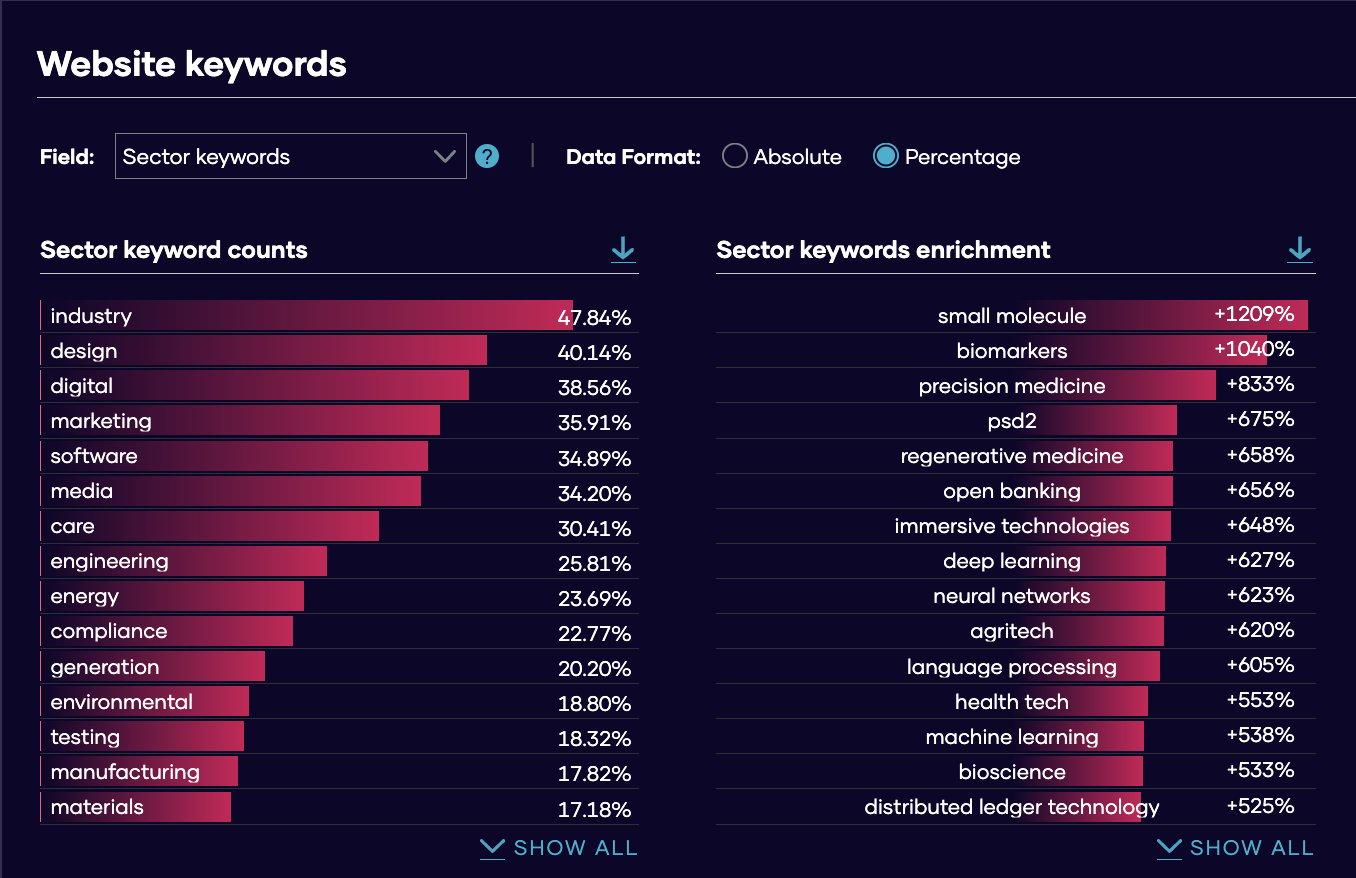
Sector keywords are not keywords from the machine learning output. If you are interested in machine learning based keywords for a list that you have made, you should read about the classifier terms.
Company Details
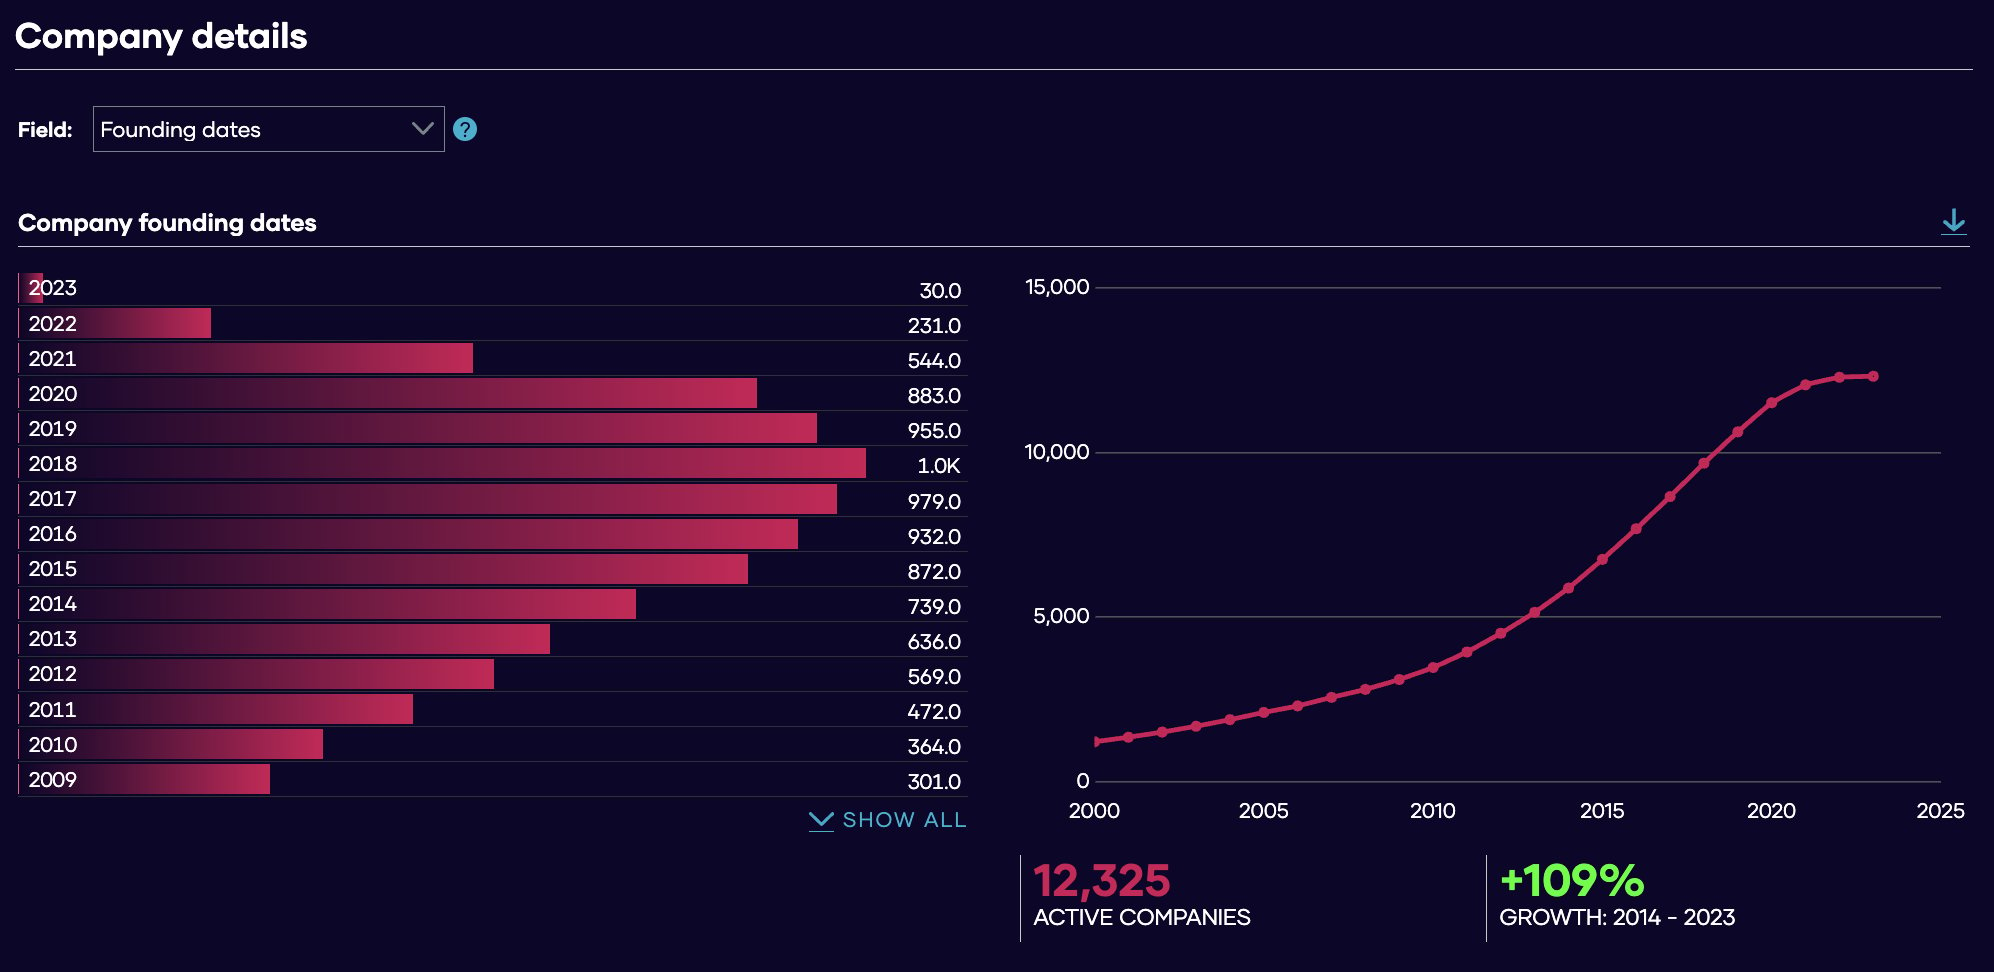
The following tab contains demographic information on the companies. From the field dropdown, you can choose Gender, Employees, Company growth, Company births and deaths, or Company trade data.Gender
The Gender section shows two 100% stacked bars (the founder gender mix and the director gender mix), each split into the six mutually-exclusive categories: all women led, majority women led, mixed led, majority men led, all men led, and uncertain. Get more information on the gender data, including how the categories are defined and why some companies are uncertain.Employees
Employees by year is the total employment of the list or RTIC. The dashed line shows our estimated value of employees. The solid line is the measured level of employees. Read more on why we estimate turnover and employment. Company size by employees shows the distribution of companies by their best estimate UK employees. In this case there are 1400 companies with zero (or unknown) UK employees.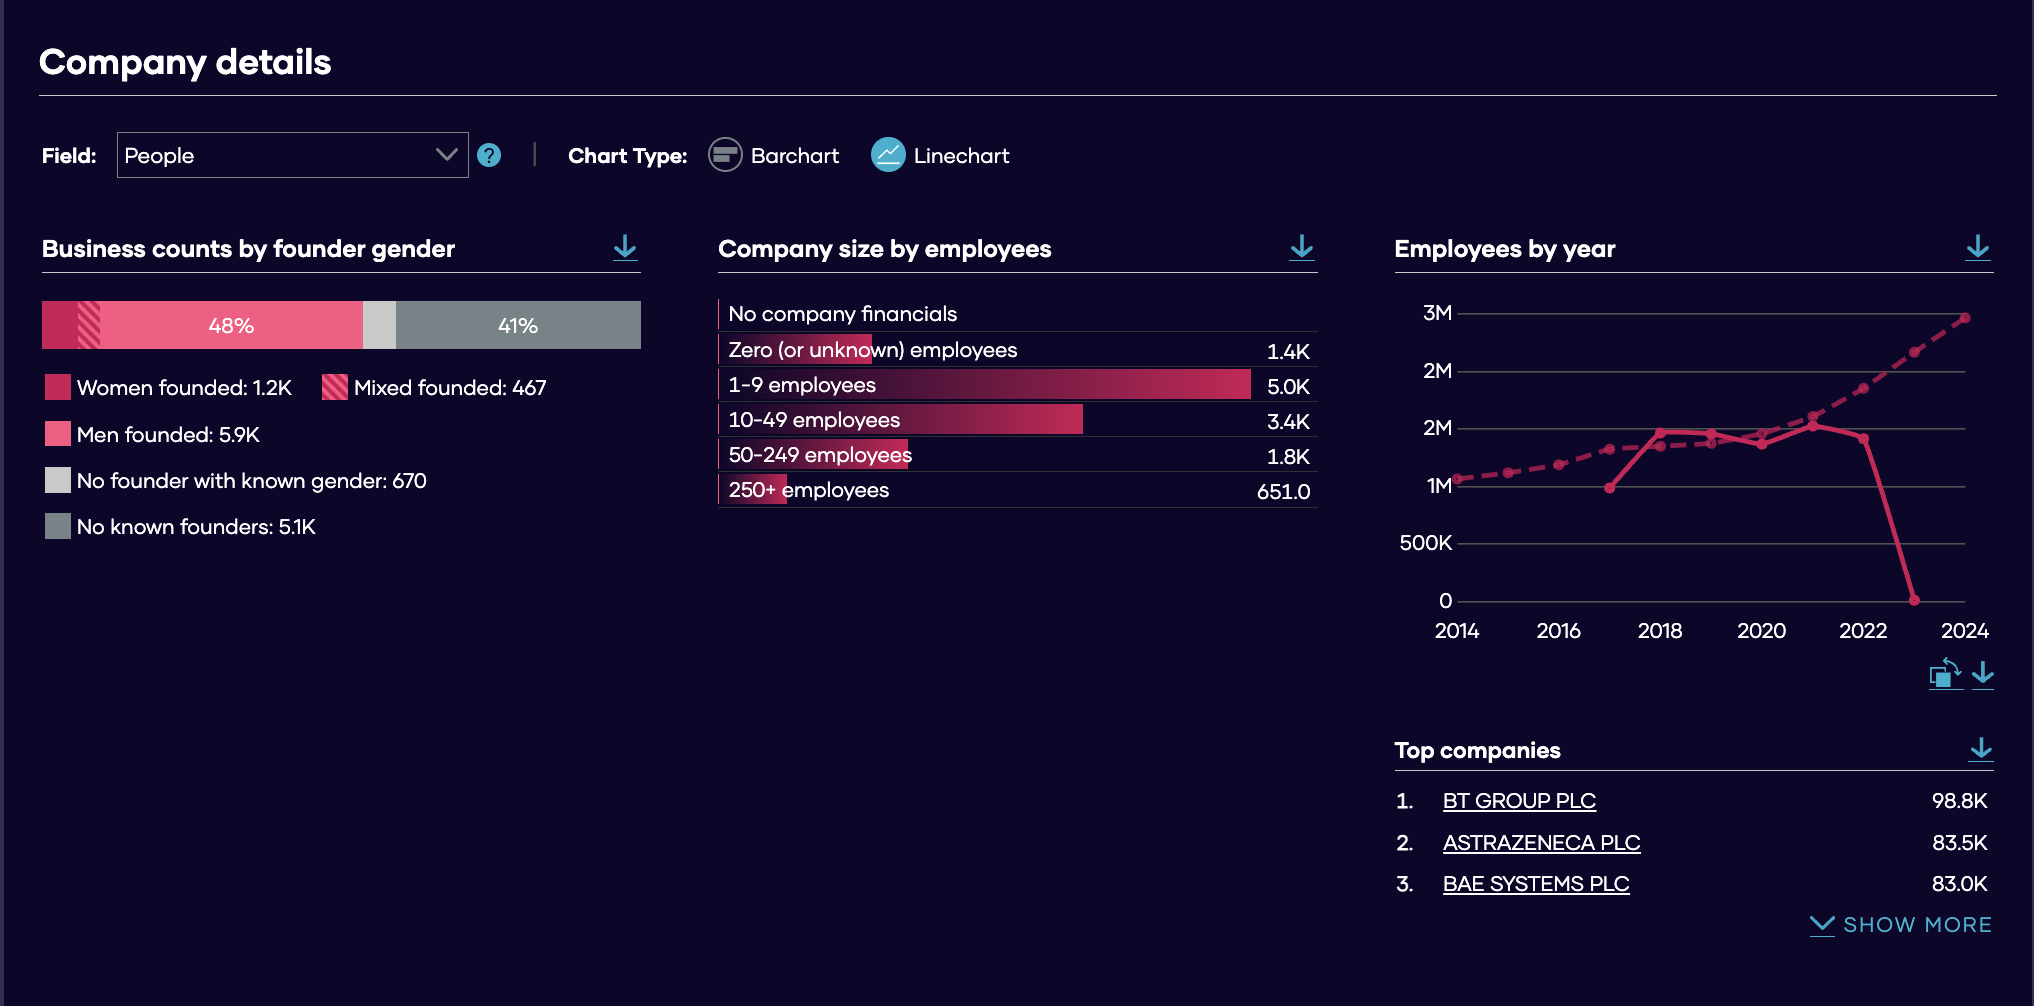
Company growth
Company size The distribution of company sizes. This takes into account the number of employees as well as turnover to define company size. Specifically, it uses the Companies Act 2006 definition. Company growth rate This shows the distribution of growth rates for companies. For example, there are 508 companies in this list that are shrinking fast.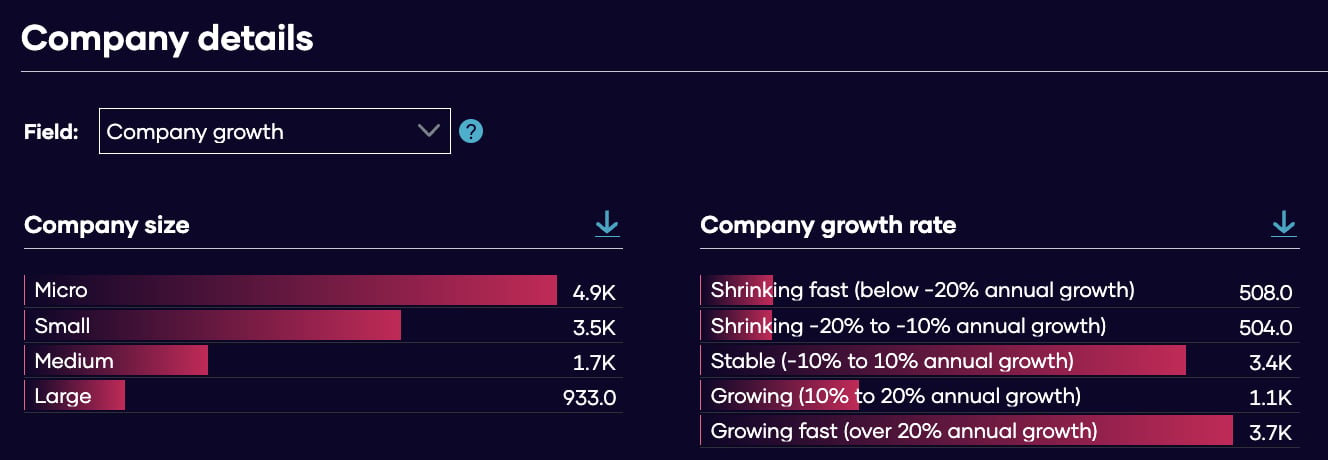
Jobs and Skills
We partner with Lightcast to be able to offer granular labour market insights on our platform. If you have subscribed for Lightcast, you will see widgets focussed on jobs and skills. SOC4 code Our widgets here show the job postings and average advertised salary by Standardised Occupational Code (SOC). Think SIC, but for occupations. Skills We show the number of advertised job postings for: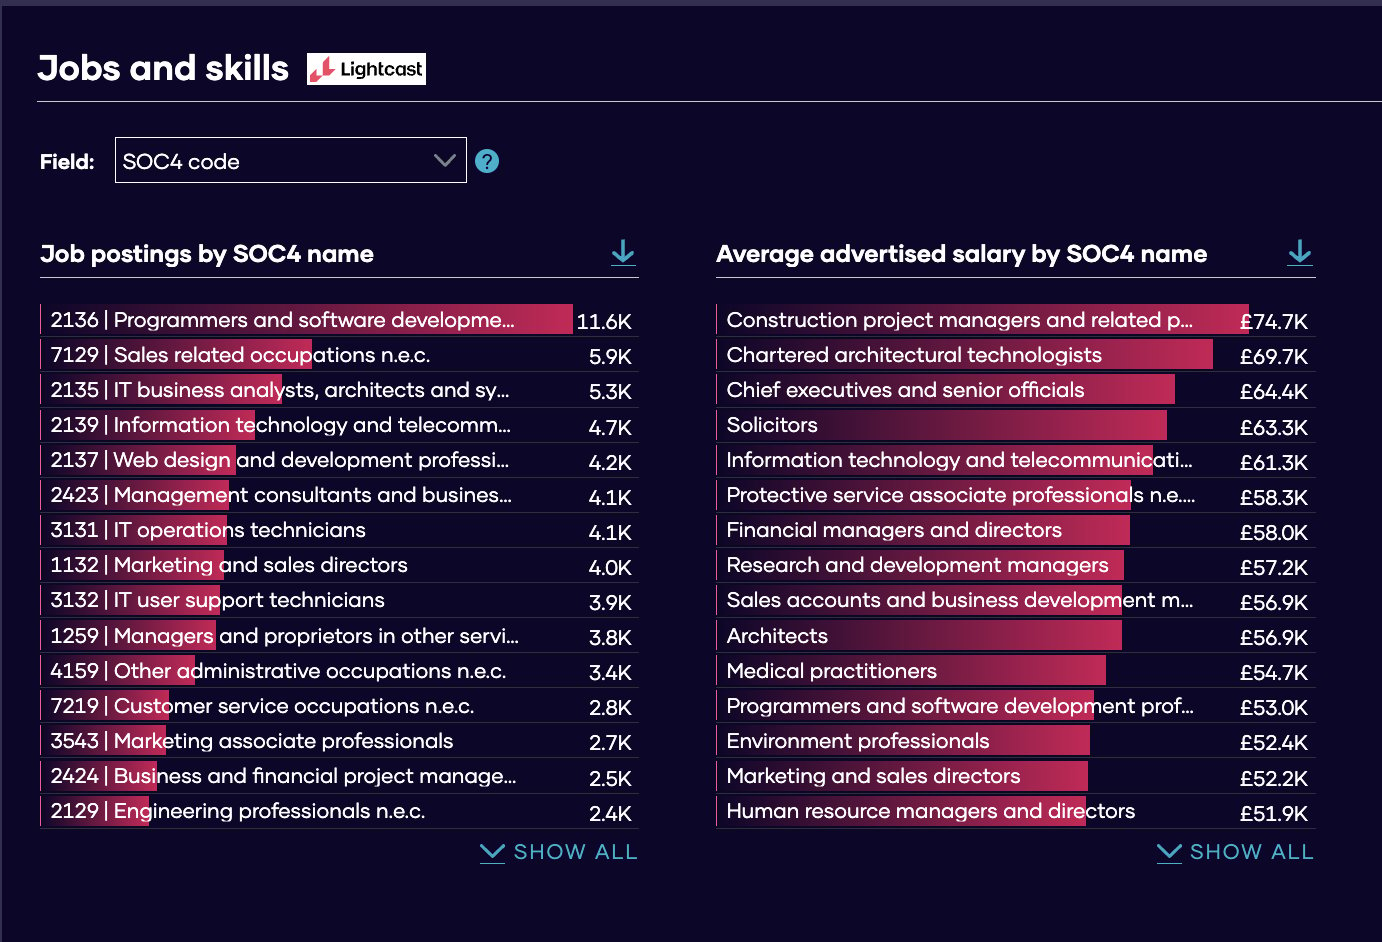
These are advertised job postings and may not necessarily be filled positions.
RTICs and Sectors
We provide a breakdown for all types of sectors on our platform: RTICs, CICs and SICs. It’s worth noting that a company can be in multiple RTICs, CICs, or SIC codes. The visualisations here show the number of companies in a sector. This does not remove double counting. At the time of writing, there are 212,000 companies that are in an at least one RTIC. Because a company can be in multiple RTICs, or multiple RTIC verticals within the same RTIC, if you sum the data from the widgets below, you will be double counting. Summing RTIC sector counts results in a number of 280,000. Be aware of double counting here.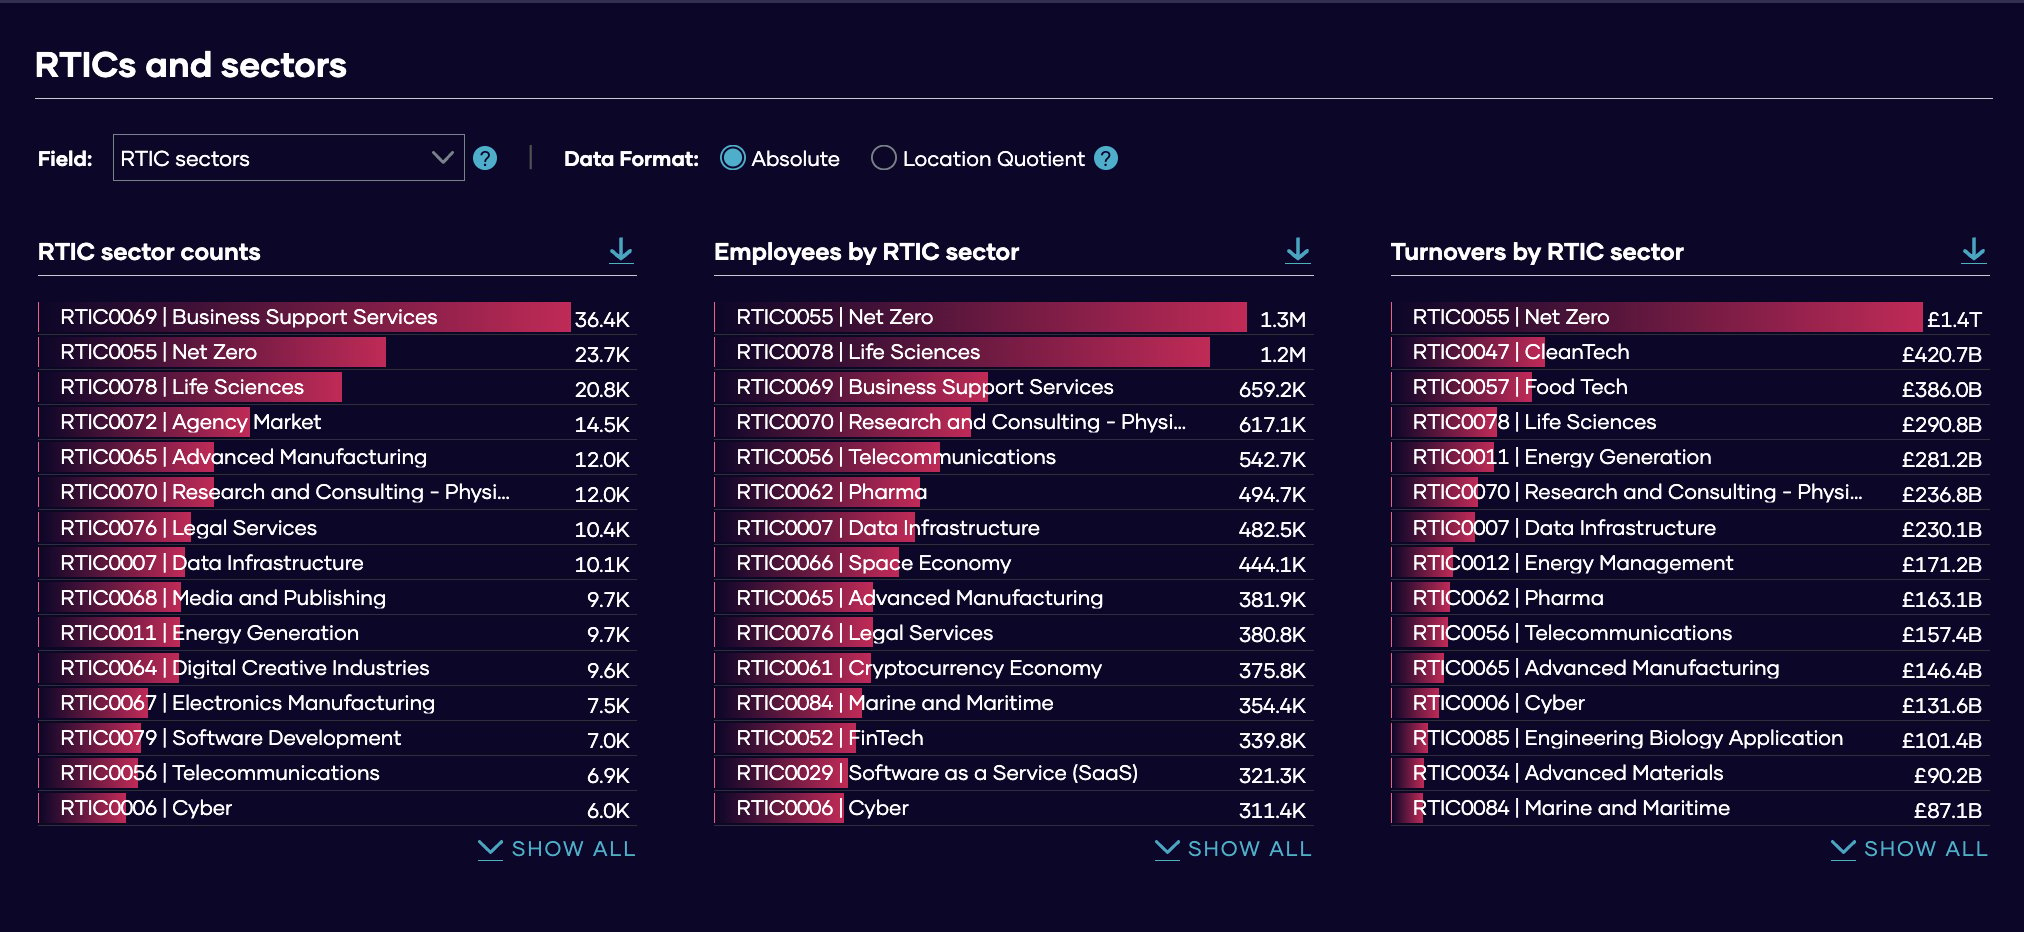
The RTIC sectors of the companies in your list that match your filters. Where a company has more than one RTIC sector it is counted more than once. Employees by RTIC sector
The number of UK employees in each RTIC sector, based on each company’s best estimate UK employees. Where a company has more than one RTIC sector it is counted more than once. Job postings by RTIC sector
Job postings data is sourced from Lightcast. Currently this data is not available to all customers. We are looking at offering this as an upgrade. Turnovers by RTIC sector
The total turnover of businesses in each RTIC sector. Where a company has more than one RTIC sector it is counted more than once.
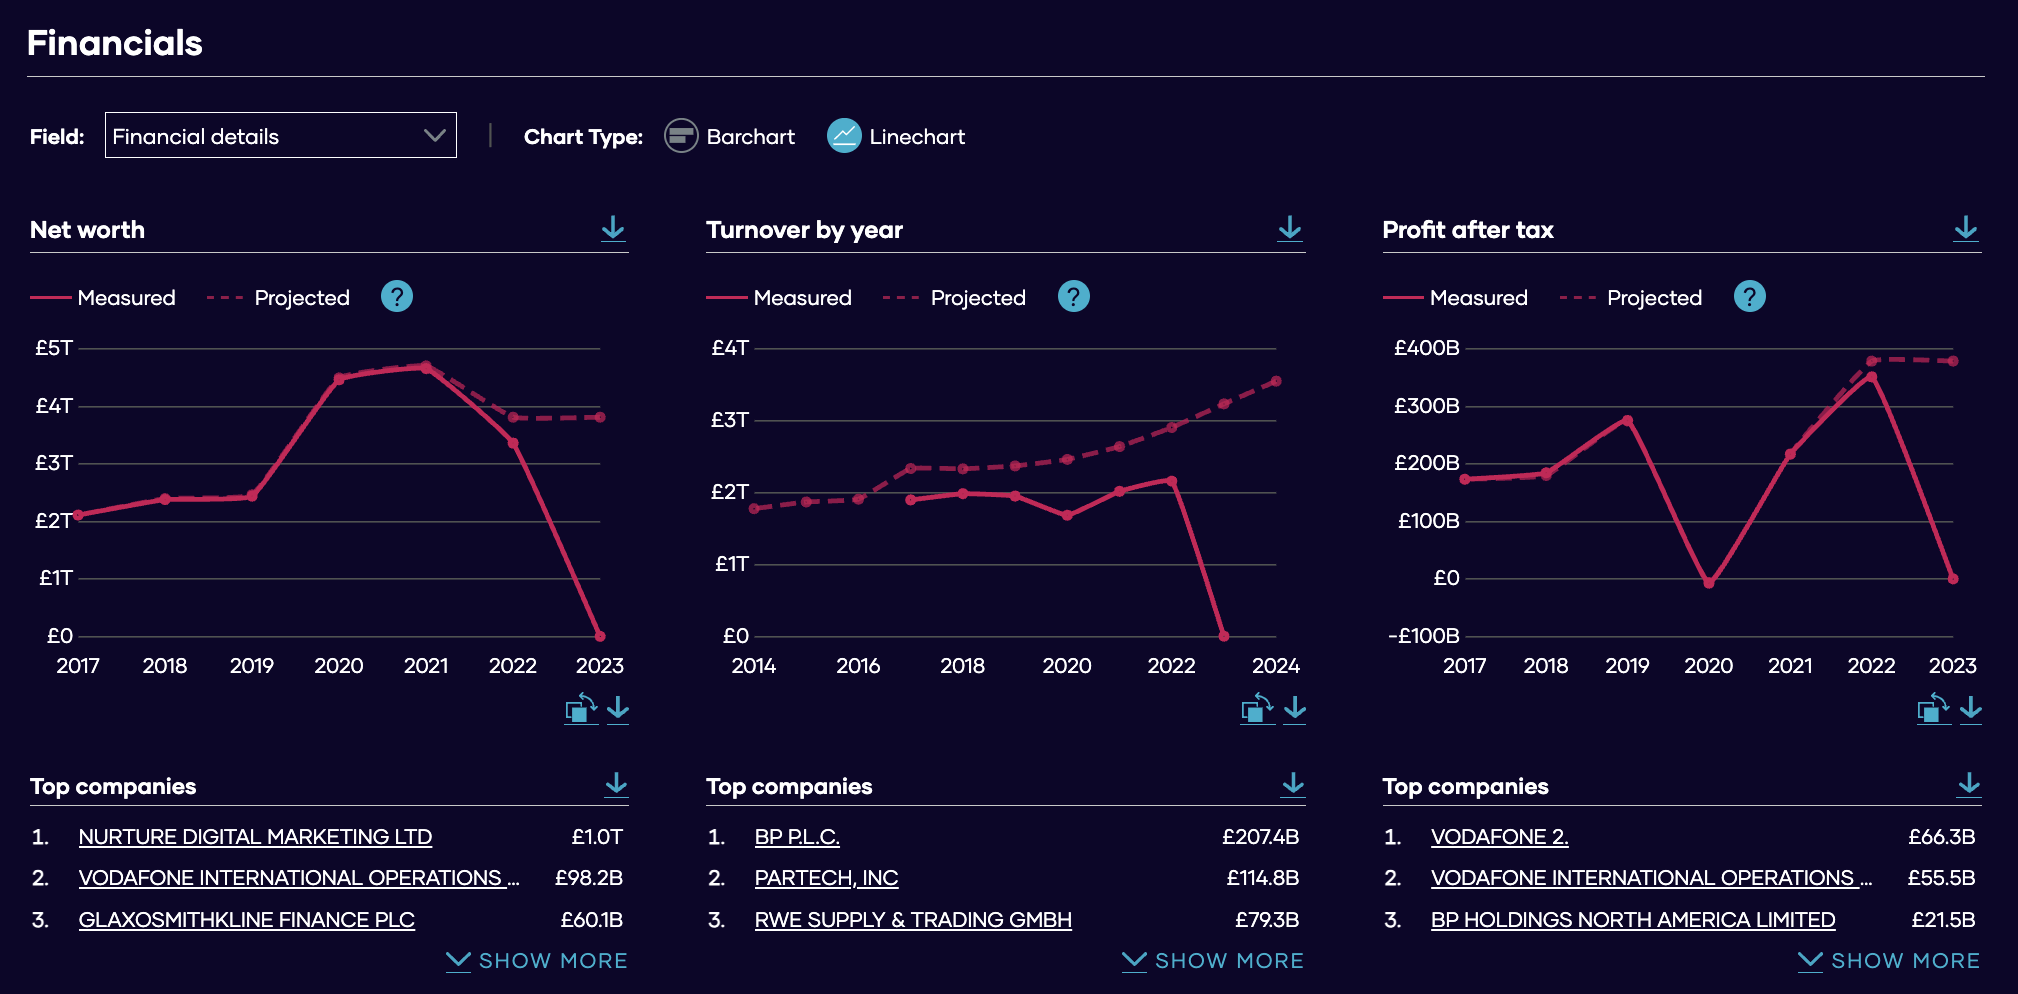
Financials
Our final tab focusses on financial details and funding information.Financial details